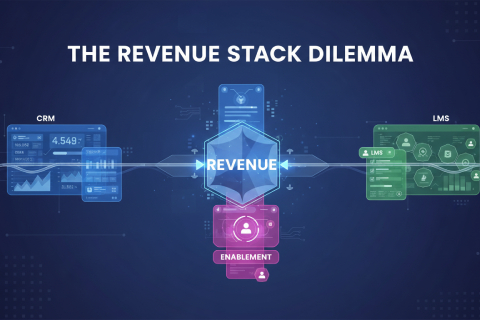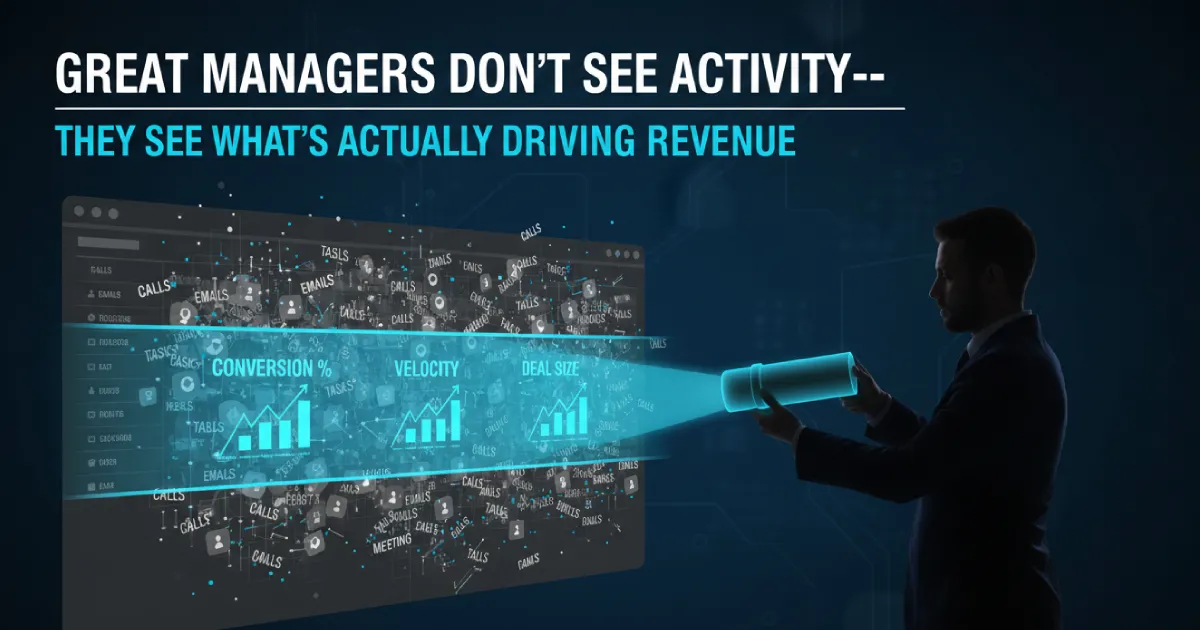

Most new sales managers mistake movement for momentum. They open their CRM dashboards and see hundreds of calls logged, dozens of emails sent, and a pipeline overflowing with supposed opportunities. Yet, the revenue tells a completely different story. In 2025, an alarming 69% of B2B sales reps missed their quotas, and heading into 2026, only 7% of sales organisations can claim a forecast accuracy of 90% or higher. This disconnect is not a lack of effort; it is a crisis of measurement. When leadership tracks vanity metrics—raw activity volume without conversion context—they create an illusion of progress while fundamentally misjudging pipeline health.
From the perspective of frontline sales teams and their direct managers, this data overload creates severe operational friction. Sellers are currently using an average of eight different tools to execute deals, yet they spend a mere 28% of their day on actual selling activities. For distributed teams across high-velocity industries like Banking, Insurance, Automotive, and Pharmaceuticals, the problem multiplies. A new regional manager staring at a dashboard showing "150 calls a day" learns absolutely nothing about execution consistency or capability gaps. If those calls are not converting into qualified meetings or advancing deals, tracking them only wastes time and alienates the sales force. It forces reps to optimise for the scoreboard rather than the buyer, creating a cycle where poor behaviour is rewarded simply because it generates a high volume of bad data.
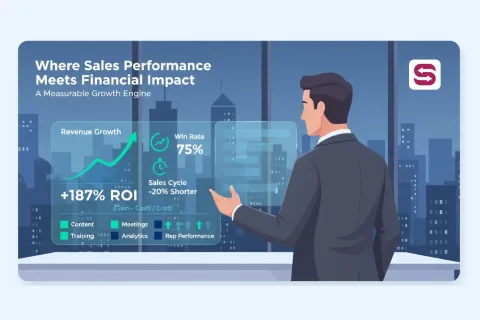
For Chief Revenue Officers and SVPs, this operational friction quickly escalates into severe financial and strategic risk. When frontline managers cannot distinguish between genuine pipeline velocity and stalled deals masquerading as active opportunities, revenue predictability collapses. Senior leadership relies on data to allocate resources, forecast quarterly earnings, and justify capital investments. If the underlying metrics are inflated by vanity data—such as tracking generic "activity scores" instead of stakeholder coverage or weighted pipeline value—executives end up making critical business decisions based on fiction. This leads to massive forecast drift, expensive misallocation of enablement resources, and the inability to prove clear ROI on sales initiatives.
The solution requires a complete structural teardown of what your organisation chooses to measure. You cannot manage a modern, distributed sales force using legacy activity quotas. You must strip away the noise. This guide breaks down the exact metrics required to establish execution consistency, identify true capability gaps, and prove definitive ROI to senior leadership. We outline the 16 essential metrics every new sales manager must prioritise to maintain pipeline integrity and revenue scalability in 2026.
Just as importantly, we explicitly identify the vanity metrics you need to permanently abandon. You will learn to swap raw email volume for meeting conversion rates, and generic training completion scores for actual post-training performance lifts. The goal is no longer to track how busy your sales team is. The goal is to track the precise leading indicators that dictate revenue growth, ensuring your reps are enabled, your forecasts are bulletproof, and your strategy is anchored in reality.
1. Lead Response Time (Track)
Lead response time measures the exact duration between a prospect submitting an inquiry and a frontline agent initiating the first meaningful contact. In high-volume, commoditised markets, speed acts as the primary differentiator. If your distributed sales teams take hours to respond to a new inquiry, you are actively funding the marketing efforts of your competitors.
The decay rate of a modern digital lead is incredibly steep. As we navigate 2026 buyer expectations, the probability of connecting with a prospect drops exponentially after the first five minutes. For Chief Revenue Officers and Sales Leaders managing large, geographically dispersed teams, tracking this specific metric exposes the unseen friction in your lead distribution systems. A consistently high average response time rarely points to unmotivated agents; it almost always indicates systemic routing bottlenecks or a lack of immediate prospect context reaching the rep.
This metric becomes critical in highly competitive sectors like insurance and NBFCs. In these industries, prospects frequently request policy quotes or loan approvals across multiple aggregator platforms simultaneously. The first agent to make contact secures the initial discovery conversation, while the second agent goes straight to voicemail. By relentlessly tracking response time, Sales Managers can pinpoint exactly which branches or teams are losing out on early engagement and instantly adjust their lead allocation strategies to favour faster responders.
The reality is similar for consumer durables and automotive sales. A digital lead in these sectors typically signals immediate, high-intent buying behaviour, such as a customer requesting a vehicle test drive or an in-home appliance demonstration. Frontline agents must intercept these buyers while their intent is at its peak, well before they physically walk into a competitor's showroom. Monitoring response speed ensures that expensive, high-intent digital signals actually translate into scheduled appointments and showroom visits rather than abandoned web forms.
However, tracking the time is purely diagnostic. When sales managers identify lagging response times, they must look beyond the clock. The most common root cause of slow engagement is agent hesitation. Frontline teams pause when they lack the exact product context, competitive battlecards, or personalised collateral needed to make that first call impactful. By combining strict response time tracking with on-the-fly enablement tools that deliver instant playbooks and relevant pitch materials, leaders remove the preparation lag, empowering their frontline agents to execute immediately and confidently.
2. Sales Cycle Length by Stage (Track)
A 120-day average sales cycle tells a Chief Revenue Officer nothing about where deals are actually dying. In 2026, enterprise sales cycles in sectors like Banking, NBFC, and Insurance average three to six months, with complex corporate policies or compliance-heavy agreements stretching up to 18 months. Tracking the total time to close is a lagging indicator that hides operational bottlenecks. Tracking cycle length by stage isolates the exact friction points. If an opportunity spends 15 days in initial discovery but 45 days stuck in the proposal phase, managers know exactly where the execution gap exists. Total duration is a metric of the past; stage duration is an operational lever for the present.
For a distributed salesforce in Automotive or Pharma, reps face highly variable hurdles across different regions. A newer agent might breeze through the initial pitch but hit a wall when technical specifications or underwriting approvals get involved. By measuring stage-level durations, Sales Leaders and SVPs can stop guessing why pipeline velocity is slowing down. It shifts the management focus from asking a generic "Why aren't you closing?" to a highly specific "Why are your deals stalling at the evaluation stage?" This granular visibility allows for immediate, surgical interventions rather than broad, ineffective training rollouts that pull reps off the field.
When a specific pipeline stage shows a bloated cycle length, frontline agents need immediate support, not a training seminar scheduled for the following quarter. If deals consistently stall during the product illustration phase—a common hurdle in consumer durables or complex building materials sales—reps need just-in-time content. Equipping them with dynamic, interactive product illustrators or automated, personalised pitch decks allows them to address buyer hesitation instantly. Delivering the exact collateral required to answer complex stakeholder questions keeps the deal moving forward without creating unnecessary follow-up loops that delay the process further.
Stagnant stages also serve as an early warning system for capability gaps. If the data shows a sales team is consistently struggling to move deals past the negotiation or objection phase, managers can deploy targeted enablement. Instead of relying on static playbooks, teams can utilise AI-driven role-plays and battlecards. Agents can practice handling specific objections—like defending premium pricing against a local competitor or navigating stringent compliance concerns—in a simulated environment before getting on the actual buyer call.
By tying cycle length directly to specific pipeline stages, organisations transform their enablement strategy from a passive content library into a highly proactive sales execution system. Managers can map out exactly where high-impact behaviours are breaking down and replicate the strategies of top performers. It ensures every agent has the precise skills, coaching, and content required at the exact moment friction occurs, driving consistent execution across the entire sales cycle.
3. Win Rate by Lead Source (Track)
Tracking win rate by lead source isolates exactly where your most profitable customers originate. Instead of relying on a blended conversion average, this metric breaks down closed-won deals against the specific channels that generated them. For Sales Leaders and SVPs managing distributed teams, it provides an objective, mathematical foundation for resource allocation, connecting frontline sales execution directly to bottom-line return on investment.
The reality on the sales floor is that frontline agents routinely waste thousands of hours working through low-intent, unqualified lists while high-value prospects grow cold. Treating every lead equally is a systemic failure. A lead generated from a direct inbound quote request requires completely different handling, pacing, and urgency than a purchased third-party contact. By tracking win rates across these distinct origins, managers can identify which channels yield prospects with the highest propensity to buy, allowing them to stop directing expensive headcount toward dead-end sources.
This metric fundamentally dictates operational strategy in high-volume, competitive environments. In the insurance sector, tracking win rate by source immediately exposes the difference between inbound digital inquiries—which require contact within minutes to maintain high conversion rates—and aggregated leads from comparison sites that historically convert in the low single digits. In banking and NBFCs, tracking separates the conversion reality of mobile app drop-offs versus partner channel referrals. Armed with this granular data, a Chief Revenue Officer can confidently redirect marketing spend, overhaul lead distribution logic, and adjust rep compensation structures to prioritise the highest-yielding channels.
Furthermore, win rate by source allows Sales Managers to build hyper-specific playbooks. When you know a specific lead source consistently delivers complex opportunities, you can route those prospects exclusively to senior performers. Conversely, if a previously reliable channel shows a declining win rate, leaders can quickly intervene. Instead of generic coaching, they can deploy targeted objection-handling battlecards and interactive product illustrators tailored specifically to the objections native to that lead source. This helps leaders precisely diagnose whether a drop-off is due to poor lead quality or a frontline capability gap.
To execute this accurately, lead attribution must remain unbroken from the first touchpoint to the closed-won status. Relying on manual data entry from busy field reps inevitably fractures this attribution. Integrating a centralised lead management system directly with frontline enablement tools ensures every interaction is automatically and accurately tagged. This architectural visibility allows enterprise organisations to stop guessing about channel effectiveness and build predictable, data-driven revenue engines based entirely on what actually closes.
4. Average Deal Size (Track)
A dropping average deal size is rarely a pipeline volume issue; it is a glaring execution and capability red flag. Frontline sales agents are naturally wired to take the path of least resistance. When faced with a hesitant buyer or a complex negotiation, rather than fighting for a premium enterprise contract or comprehensive product bundle, reps will systematically down-sell early to secure a quick, friction-free win. For Chief Revenue Officers and SVPs managing distributed geographies, this metric acts as the ultimate lie detector for sales floor confidence. It exposes whether your team is actively selling on value or simply functioning as order-takers for your lowest-tier offerings.
Consider the daily reality of distributed frontline teams in banking, insurance, or consumer durables. If a Relationship Manager's average deal size is shrinking, they are likely not pitching the high-margin wealth management plan, the comprehensive family policy, or the premium automotive financing package. Instead, they are defaulting to basic, low-margin products because they lack the conversational authority to justify premium pricing. The psychological fear of losing the deal entirely overrides the organisational mandate to cross-sell. By meticulously tracking the exact revenue per closed opportunity, Sales Managers can pinpoint precisely when and where reps are abandoning the ideal target profile just to avoid complex objection handling.
The root cause of this metric's decline is rarely a lack of effort; it is a systemic lack of on-the-fly enablement. If reps do not have instant access to dynamic pitch tools, competitive battlecards, or interactive product illustrators during a live conversation, they cannot effectively prove the premium value to the buyer. Consequently, they retreat to the safest, cheapest option. Modern sales execution data from 2026 shows that average deal sizes suffer most when reps operate without a structured, accessible methodology, leading them to secure small-ticket, transactional deals rather than commanding comprehensive contracts. Tracking this metric at the cohort, tenure, and regional levels highlights exactly which territories are suffering from this critical confidence gap.
Correcting a shrinking average deal size requires more than mandating higher quotas; leaders must structurally remove the friction associated with selling premium products. When the metric dips, it should serve as an immediate trigger to deploy targeted, capability-building interventions. Sales leaders must inject just-in-time content and AI-driven role-plays directly into the rep's daily workflow, focusing explicitly on handling premium price objections. By equipping frontline agents with interactive, personalised pitches that logically and visually justify higher price points, managers restore rep confidence. This structural advantage enables distributed teams to hold the line on pricing, control the discovery process, and consistently execute against the most profitable target profiles.
5. Pipeline Velocity (Track)
Pipeline velocity is the ultimate pressure test for your revenue engine. It strips away the illusion of a bloated CRM by reducing pipeline health down to a single objective metric: the actual revenue value moving through your sales funnel every single day. Calculated by multiplying the number of active opportunities, average deal size, and win rate, then dividing the total by your average sales cycle length, it forces an honest look at execution. While an individual metric like opportunity count can create a false sense of security, pipeline velocity exposes exactly how fast your team is turning prospects into revenue.
For distributed sales teams in high-volume, high-stakes industries like banking, consumer durables, or insurance, raw pipeline volume is often misleading. Sales leaders frequently look at dashboards showing massive pipeline coverage, yet still miss the quarter's revenue target. The root cause is almost always stagnant deals that sit in the system but never progress. By tracking pipeline velocity, you instantly detect when execution slows down. If frontline agents struggle to handle complex product objections or navigate strict compliance requirements, cycle lengths expand, win rates drop, and daily velocity plummets—even if the total number of leads looks healthy.
The primary use case for this metric is diagnosing specific capability gaps across a decentralised workforce. Because velocity relies on four distinct levers, it acts as a highly accurate diagnostic framework. If the velocity drops, a regional manager can immediately isolate the problem. A low win rate indicates a need for better objection handling and on-the-fly enablement. A shrinking average deal size suggests agents are defaulting to smaller, easier products rather than cross-selling effectively. An extended sales cycle highlights friction in the closing process or a lack of compelling, just-in-time content to drive buyer urgency.
Pipeline velocity is also the most accurate way to measure the financial impact of your sales enablement initiatives. Current 2026 benchmark data indicate that daily pipeline velocity in financial services averages around $2,134 per day, while B2B technology segments sit around $1,847 per day. If you deploy a new interactive product illustrator or launch an AI-driven role-play program to sharpen pitch delivery, tracking velocity proves whether the intervention actually worked. You are not just measuring the completion rates of a learning journey; you are directly observing if the new initiative shortened the sales cycle or increased the win rate.
Make pipeline velocity a standard part of weekly regional reviews. Do not compare it purely to external industry benchmarks, as these vary wildly depending on deal complexity and market segment. Instead, track it as an internal baseline to ensure consistent quarter-over-quarter improvement. When sales managers treat velocity as the ultimate scoreboard, they stop hoarding dead leads and start focusing on the high-impact frontline behaviours that actually accelerate revenue.
6. Gross Activity Volume: Raw Dials and Emails (Skip)
In 2026, the average B2B dial-to-connect rate sits at a punishing 3% to 10%, with overall dial-to-meeting conversions hovering around a mere 2.3%. Against this mathematical reality, pushing a frontline sales agent to blindly hit a quota of "100 dials a day" does not generate a pipeline. Instead, it accelerates territory burnout. When an agent makes 100 poorly researched calls or blasts 500 generic emails, they are systematically disqualifying your total addressable market. Gross activity volume, stripped of conversion context, is the ultimate vanity metric. It masks deep execution flaws—such as weak objection handling or poor pitch delivery—under the dangerous illusion of hard work.
However, an objective analysis reveals a narrow set of specific use cases where tracking raw gross activity actually shines. The primary application is establishing early operational baselines during the onboarding phase. For a frontline agent in their first 30 days, gross volume serves as a pure diagnostic tool to measure system familiarity, platform adoption, and basic operational stamina. Similarly, when RevOps teams are testing new technical infrastructure—such as verifying email deliverability health or ensuring a new parallel dialer is successfully bypassing telecom spam filters—raw activity volume is necessary to confirm the plumbing works. In these isolated scenarios, volume is a technical diagnostic, not a measure of sales performance.
Once those initial baselines are set, tracking raw volume becomes an operational liability. In high-stakes industries like Banking, Pharma, Insurance, and NBFC, the prospect pool is highly guarded and finite. Every connected call is an expensive, hard-won asset. When a Chief Revenue Officer or Sales SVP focuses exclusively on output, it incentivises reps to rush through interactions just to satisfy a dashboard. The focus must aggressively shift toward execution quality and conversation-qualified metrics, such as the Connect-to-Meeting Rate or Objection Handling Success.
To capitalise on this shift, sales leaders must stop managing spreadsheets and start managing capability gaps. Driving multi-fold business growth requires equipping distributed teams with the tools to make every rare connection count. This means replacing rigid dial quotas with on-the-fly enablement, AI-driven role-plays, and interactive battlecards that guide the agent through the specific nuances of a consumer durable or automotive pitch. When reps are supported with just-in-time content and playbook automation, they no longer need to burn through 100 leads to find a single win.
Ultimately, measuring pure volume without measuring the quality of the interaction rewards the wrong behaviour. By abandoning vanity metrics and focusing on how well frontline teams execute during the actual conversations, sales managers can replicate high-impact behaviours across their entire geography. Quality execution, supported by real-time sales enablement, ensures that when a prospect finally answers the phone, the rep is primed to convert, not just log another dial.
7. Meeting-to-Opportunity Conversion (Track)
Meeting-to-opportunity conversion acts as the ultimate lie detector for a sales pipeline. A packed calendar creates the illusion of productivity, but tracking this specific metric tells sales leaders whether frontline reps are conducting rigorous upfront qualification or simply logging low-intent interactions to satisfy weekly activity quotas. In complex enterprise sales environments like NBFC, Banking, or Insurance, a healthy meeting-to-opportunity rate generally hovers between 30% and 50%. When this conversion rate drops below standard benchmarks, it is a clear indicator that the pipeline is bloated with unqualified leads.
Consider the daily reality of a distributed sales agent in the consumer durables or automotive sector who books twenty initial meetings in a week. If only three of those conversations advance to formalised opportunities with clear commercial intent, the core issue is a broken discovery process. The rep is likely failing to verify budget, buying authority, or timeline constraints. They are taking every meeting without asking the hard qualifying questions, exhausting both their own selling hours and the prospect's time.
Low conversion at this stage highlights a glaring need for immediate intervention. Agents often avoid aggressive qualification early in the cycle because they fear losing a potential prospect, or they simply lack the structural framework to uncover true pain points. Instead of focusing heavily on late-stage negotiation, sales managers must shift their attention to early-stage discovery coaching.
This is where Sharpsell.ai equips enterprise teams to fix the qualification gap at scale. Sales managers can deploy AI Role-plays to simulate early-stage discovery calls, forcing reps to practice identifying business needs and disqualifying bad fits in a safe, controlled environment. If a rep consistently struggles to qualify effectively, managers can instantly pinpoint this capability gap and assign targeted Learning Journeys before the rep burns another live lead.
During the actual engagement, frontline agents need immediate structural support. Using PitchWiz, teams can generate highly personalised discovery tracks tailored to the specific industry and stakeholder profile they are meeting. When prospects deflect qualification questions, dynamic Objection Handling and Just-in-time Content serve up exact responses and Battlecards. This keeps the conversation anchored to strict qualification criteria and tangible business value rather than drifting into generic product pitches.
By optimising the meeting-to-opportunity metric, Chief Revenue and Business Officers strip away vanity activity data. They ensure distributed workforces execute with consistency, spending their time only on high-intent buyers. Instead of managing a massive, stagnant pipeline of stalled deals, leadership teams can drive multi-fold business growth built strictly on accurately qualified, highly winnable opportunities.
8. Opportunity-to-Win Conversion (Track)
Opportunity-to-Win conversion is the ultimate stress test for sales execution. While healthy opportunity-to-win ratios generally hover around 20% to 30%, a sudden drop-off at this late stage rarely indicates a top-of-funnel pipeline issue. Instead, it exposes critical execution gaps right at the finish line. For enterprise teams in high-stakes industries like banking, insurance, and pharma, losing a deal after the proposal stage points directly to reps failing in objection handling, competitive positioning, or final pricing negotiations.
When a distributed sales force starts losing winnable deals to competitors, Sales Leaders and SVPs cannot afford to wait weeks for a quarterly post-mortem. Frontline agents in NBFCs or automotive are constantly face-to-face with buyers armed with competitor pricing and technical counter-arguments. If an agent stumbles on a specific product objection or fails to clearly differentiate their offering, the deal dies. Sales Managers need to instantly identify these capability gaps to prevent them from cratering the forecast.
A localised drop-off in opportunity-to-win rates demands immediate tactical intervention. This is where Sharpsell.ai’s Objection Handling & Battlecards step in to stop the bleeding. When a frontline agent in consumer durables or building materials is facing a sudden wave of competitor-driven objections, pushing an updated, dynamic battlecard directly to their device equips them to defend their value immediately. They do not have to search through stagnant repositories for answers; Just-in-time Content delivers the exact competitive positioning they need while the buyer is still engaged.
Fixing the immediate leak must be paired with correcting the underlying skill deficiency. Using Learning Journeys and AI Role-plays, Sales Managers can deploy targeted, scenario-based practice environments within hours of spotting a conversion dip. If CRM data shows reps struggling against a specific new commercial vehicle loan from a competitor, managers can assign an AI role-play focused entirely on that scenario. Reps practice their negotiation capability against a hyper-realistic AI buyer, receiving immediate, objective feedback on their tone, accuracy, and counter-arguments before they test them on real prospects.
For Chief Revenue and Business Officers in 2026, moving the needle on opportunity-to-win conversion requires replicating high-impact behaviours across thousands of distributed agents. Sharpsell.ai’s Copilot and PitchWiz automate this standard of excellence, ensuring that whether an agent is in a major financial hub or a regional territory, they execute the exact same field-tested sales playbook. By directly linking late-stage pipeline analytics with on-the-fly enablement, enterprise organisations secure their revenue, eliminate late-stage deal slippage, and close with consistency.
9. Quota Attainment Distribution (Track)
Looking at aggregate branch numbers is the fastest way to misjudge the health of a distributed sales team. In 2026, average B2B quota attainment sits at a bleak 43%. If a regional branch hits its revenue target, but 80% of the closed deals were driven by two veteran reps out of a ten-person team, that branch is not successful—it is fragile. Quota Attainment Distribution forces Chief Revenue Officers and Sales SVPs to look past the blended average and see exactly who is actually executing the sales playbook and who is just taking up headcount.
This metric is critical for leaders managing highly distributed teams across sectors like banking, consumer durables, and automotive. In these industries, a single top performer can easily mask the capability gaps of an entire regional office. When that star seller inevitably gets poached or promoted, the branch forecast collapses overnight. By tracking the distribution curve of quota achievement, sales managers can immediately identify whether their execution strategy is scalable or completely dependent on individual heroics.
The true value of this metric lies in how it directs enablement resources. When a sales manager sees a wide gap between their top 20% and the rest of the pack, it is a clear signal that the core sales plays are not being successfully replicated. The middle pack does not lack motivation; they lack the real-time execution support that veterans have internalised over the years. This is exactly where targeted interventions become necessary. Instead of pulling the entire team off the floor for a generic workshop, leaders can isolate the struggling reps and provide them with just-in-time content, dynamic battlecards, and interactive product illustrators tailored to the exact deals they are losing.
Tracking distribution also highlights precise coaching opportunities. If reps in a specific territory are failing to move from 50% to 80% attainment, managers can deploy AI role-plays and targeted learning journeys to drill down on specific weaknesses, such as objection handling or complex product pitching. It shifts the burden of success from the individual rep’s raw talent to the organisation’s enablement infrastructure.
Ultimately, normalising the quota distribution curve is the only path to multi-fold business growth. When you stop relying on a few outliers to carry the numbers, you build a resilient, execution-focused system. Frontline agents receive the personalised, on-the-fly support they need to close deals confidently, and revenue leaders gain the execution consistency required to scale operations across any geography without losing sleep over rep turnover.
10. Unweighted Total Pipeline Value (Skip)
Relying on an unweighted total pipeline value creates an optical illusion of safety for sales leaders. A $15 million pipeline looks impressive on a regional dashboard, but it is a dangerously misleading metric if $12 million of that volume consists of stalled, early-stage deals. For Chief Revenue Officers and SVPs managing distributed teams across banking, insurance, or automotive sectors, planning around raw opportunity volume is the fastest route to missing quarterly targets. An unweighted model treats a deal in preliminary discovery with the exact same revenue expectation as a finalised contract sitting in legal review. This fundamental flaw masks pipeline rot and rewards frontline agents for hoarding stagnant opportunities rather than advancing them.
The immediate fix is to skip the unweighted vanity metric and focus entirely on probability-weighted pipeline forecasts. By multiplying the total deal value by the historical or AI-driven probability of its specific stage, leaders get a mathematical reality check. A $500,000 enterprise opportunity with a 20% historical win rate in the discovery phase contributes only $100,000 to the forecast. This approach strips away representative bias and forces sales managers to confront genuine revenue potential. In complex, high-stakes environments like pharmaceutical enterprise sales or NBFCs, where sales cycles are protracted, weighting the pipeline provides a grounded view of expected revenue based on actual execution metrics rather than wishful thinking.
This analytical shift shines brightest in frontline coaching and enablement. When managers stop tracking total unweighted value, reps can no longer hide behind massive, static numbers. Instead, the gap between the unweighted volume and the weighted forecast becomes a precise diagnostic tool. If a regional team has a large unweighted pipeline but a critically low weighted forecast, it signals a severe execution breakdown in the middle of the funnel. Managers can immediately identify capability gaps, realising that agents are generating initial interest but failing to handle objections or secure commitments. This allows leaders to deploy targeted, just-in-time enablement—such as interactive battlecards or AI role-plays—exactly where the team is stalling.
Weighted forecasting also transforms strategic resource allocation. By the end of 2026, industry data shows that 65% of B2B sales organisations are transitioning to data-driven forecasting specifically to avoid the operational chaos caused by missed projections. An accurate weighted pipeline dictates where SVPs deploy their most experienced overlay specialists, direct marketing spend, and focus their competitive enablement content. It prevents organisations from over-hiring based on inflated pipeline numbers and ensures that revenue projections are anchored in field-tested realities.
Ultimately, the unweighted pipeline value is a metric of activity, not outcomes. Tracking it as a primary performance indicator breeds complacency. By discarding it in favour of a strictly weighted, probability-adjusted analysis, sales leaders gain the execution consistency required to drive multi-fold business growth. It aligns the entire revenue organisation around what will actually close, ensuring that every enablement effort and coaching conversation focuses strictly on converting active pipeline into recognised revenue.
11. Time Spent Selling vs. Admin Work (Track)
Sales representatives currently spend an average of just 28% of their workweek actively selling. The remaining 72% is entirely consumed by operational drag: hunting down the right presentation materials, manually updating CRM records, conducting account research, and navigating internal approvals. For Chief Revenue Officers and Sales SVPs, this metric exposes a massive leak in profitability. You are paying high-value frontline teams to act as data entry clerks and librarians rather than deal closers. Tracking the ratio of time spent selling versus administrative work is the fastest way to diagnose why a fully staffed team is missing quota.
In complex, highly regulated industries like banking, insurance, and consumer durables, this operational drag compounds quickly. Frontline agents in these sectors do not just need a standard deck; they require highly specific, compliant collateral tailored to the exact prospect. When a wealth manager or insurance agent spends 45 minutes searching for the latest interactive product illustrator or digging through portals to find the right objection-handling battlecard, the buyer's momentum stalls. The longer a rep spends assembling the pitch, the longer the sales cycle stretches. Tracking this metric directly quantifies the cost of manual preparation and fragmented tech stacks.
Monitoring this ratio shifts the management focus from punishing reps for low activity to fixing structural bottlenecks. When sales leaders see that their top performers are artificially capped by CRM administration, the conversation moves from effort to enablement. The data clearly justifies the investment in a unified sales execution system. If a frontline agent is forced to build presentations from scratch or manually log every interaction, their output is physically limited. You cannot drive multi-fold business growth on top of manual administrative work.
The solution lies in aggressive playbook automation. By deploying tools that provide on-the-fly enablement, organisations can automate the busywork that destroys productivity. When a rep accesses a system that instantly generates hyper-personalised pitches, surfaces just-in-time content based on the deal stage, and provides AI-driven Copilot assistance for immediate objection handling, the dynamic changes completely. They no longer search for answers; the exact right collateral comes to them. This level of sales playbook automation effectively eliminates the preparation phase, allowing reps to transition directly from identifying a gap to executing the pitch.
Top-performing organisations use this metric as a strategic lever. Moving a team from 28% active selling time to 35% or 40% delivers the equivalent of adding five to eight extra selling weeks per rep each year. By automating pitch creation, CRM data capture, and content delivery, revenue leaders can extract maximum value from their existing headcount. Reclaiming wasted administrative hours ensures that frontline sales teams focus entirely on what drives the business forward: executing the playbook and closing the deal.
12. Rep Ramp-to-Productivity Time (Track)
Ramp-to-productivity time measures the exact number of days it takes for a new sales hire to consistently hit their target quota. For Chief Revenue Officers and SVPs managing distributed teams across wide geographies, this metric acts as a direct ledger of onboarding efficiency. Every additional week a frontline agent spends in training without closing deals burns through the hiring budget and delays crucial time-to-revenue. In fast-moving, high-attrition sectors like banking, insurance, and automotive, shrinking this timeline is not just an operational goal; it is a financial necessity to mitigate the risk of new hires.
The daily reality for most new agents is overwhelming. Traditional onboarding relies heavily on static classroom sessions and dense product manuals. A new frontline sales agent in an NBFC or consumer durables sector might spend three weeks memorising complex interest rate structures, warranty details, and compliance guidelines, only to freeze during their first live customer interaction. They lack the practical, situational reps needed to build confidence. When managers cannot track the exact capability gaps of their new hires, they end up putting underprepared agents into the field. This oversight leads to blown leads, frustrated customers, and early employee churn before the company even recovers the acquisition cost of the hire.
Tracking this metric clearly exposes the failure points of legacy training models and emphasises the need for continuous, on-the-fly enablement. Instead of front-loading massive amounts of information, high-performing sales teams transition to targeted learning journeys paired with just-in-time content. When a new insurance agent is assigned their first batch of leads, they do not need to review a sprawling 50-page manual. They need immediate access to tailored battlecards, objection-handling scripts, and interactive product illustrators that guide them through the specific conversation for that exact prospect profile.
To actively drive this metric down, sales managers must deploy AI role-plays to simulate real-world buyer scenarios. Before a new rep ever dials a live number or steps into a dealership, they can practice their pitch against a dynamic AI that mimics tough customer objections. Managers can track how quickly a rep masters these simulated conversations to accurately predict their field readiness. The agent receives immediate, objective feedback, allowing them to refine their approach without risking actual revenue. This continuous loop of structured practice and targeted enablement ensures that when the rep finally faces a real customer, they execute with the precision of a seasoned veteran.
Start tracking this metric by establishing a rigid baseline for "productivity." This could be closing the first three deals, independently running a successful product demonstration, or hitting full quota. Compare the ramp times of different hiring cohorts over the course of 2026 to verify if your adjustments in learning journeys and enablement tools are actively reducing the days to full competency.
13. Content and Playbook Utilisation (Track)
Content and playbook utilisation measures exactly what your frontline agents rely on when sitting across from a prospect. Instead of guessing if your team is following the mandated sales process, this metric tracks the active deployment of approved collateral, interactive product illustrators, and dynamic battlecards during live pitches. High utilisation of these specific tools is a direct leading indicator of win rates, making it a critical metric for any sales manager trying to standardise execution across distributed teams.
In industries with complex or highly regulated product portfolios—like insurance, banking, or automotive—frontline agents often struggle to recall exact specifications, compliance details, or pricing structures. Left to their own devices, agents frequently revert to outdated PDF brochures, manual calculations, or generic pitches that fail to address the buyer's specific context. Tracking utilisation exposes these rogue behaviours immediately. If conversion rates are dropping in a specific territory, this metric reveals whether agents are actually deploying the playbooks designed to handle local objections or if they are simply winging it.
Consider the deployment of an interactive product illustrator in consumer durables or NBFCs. When a frontline agent uses a dynamic tool to visually demonstrate ROI, compare models, or calculate custom loan terms on the fly, prospect engagement increases. By tracking how often these specific interactive assets are opened, presented, and shared during a pitch, sales managers can draw a definitive line between asset usage and closed-won deals. You no longer have to ask your reps what happened in the meeting; the utilisation data shows exactly which materials drove the conversation forward.
Tracking this metric also provides the blueprint for replicating your top performers. When you analyse the utilisation data of your highest-converting agents, you will find consistent patterns in the just-in-time content or specific battlecards they pull up to neutralise common objections. As a sales leader, you can take this exact data to identify capability gaps in your mid-tier performers. You can then build targeted learning journeys or AI role-plays based entirely on the proven, field-tested materials your top reps are using to win deals today.
To deploy this metric effectively, you must skip vanity indicators like "total portal logins" or "document downloads." Focus strictly on active execution metrics: the percentage of live pitches that included an interactive collateral presentation, which specific objection-handling playbooks were accessed during active deals, and the rate at which personalised pitches were generated and sent. Tracking these specific actions transforms your enablement strategy from passive content management into an active, revenue-driving execution system.
14. Proposal-Sent to Closed-Won Ratio (Track)
A bloated pipeline is a liability, not an asset. When frontline agents consistently send quotes but watch deals stall, it signals a critical execution gap. A low Proposal-Sent to Closed-Won ratio—often anything below the standard 20-35% baseline—isolates a specific vulnerability: the agent can build initial rapport and present a solution, but they completely lack the tactical muscle to establish urgency or defend commercial value at the finish line.
In high-volume, execution-heavy sectors like Insurance, NBFC, or Automotive, generating a proposal requires underwriting resources, estimation time, and operational bandwidth. When distributed sales teams treat quote delivery as the finish line, they drain organisational resources without driving revenue. Tracking this metric strips away the vanity of "busy work" and identifies the exact agents suffering from "happy ears" syndrome—those who mistakenly assume a requested quote guarantees a signed contract.
When deals die at the proposal stage, the friction is rarely about the product itself. The stall is almost always rooted in price, timing, or competitive positioning. Frontline agents often freeze when faced with commercial pushback like "your premium is too high" or "we need to think about it." Without a structured closing framework, they default to aggressive discounting or passive, check-in emails. This destroys profit margins, lengthens the sales cycle, and yields total control to the buyer.
Tracking this ratio allows Sales Leaders and Managers to deploy surgical interventions rather than wasting time on generic sales training. Agents with high proposal volume but low conversion do not need another course on product features; they need intense, targeted repetitions on navigating the bottom of the funnel. By leveraging AI role-plays, managers can drill these specific agents on pricing negotiations, urgency-building tactics, and competitor comparisons until the execution becomes automated muscle memory.
To permanently correct a failing Proposal-to-Close ratio, the frontline must also be equipped for the moment of truth. Providing instant access to dynamic battlecards and objection-handling frameworks ensures agents do not stumble when buyers introduce last-minute demands. By utilising interactive product illustrators and just-in-time content during the final pitch, agents can shift the focus from a flat price tag to customised, measurable value. This transitions the sales force from simply delivering quotes to actively defending them, ensuring execution consistency and driving multi-fold revenue growth.
15. Pitch Adherence Score (Track)
The Pitch Adherence Score measures exactly how closely your frontline sales agents follow established, field-tested playbooks during live customer interactions. For Sales SVPs managing thousands of distributed agents—whether across regional bank branches or widespread automotive dealerships—the actual customer conversation often becomes a black box. You know if a deal closed, but you rarely know if the agent delivered the intended brand narrative or completely improvised. Tracking adherence brings visibility to execution consistency at the ground level.
Instead of relying on subjective ride-alongs or self-reported updates, modern sales organisations extract this score objectively using two methods: AI role-plays and live call analysis. Before stepping into a critical meeting, agents practice their pitches in simulated environments. The system scores their delivery against the baseline playbook, identifying skipped steps or weak objection handling. During the actual call, conversational AI tracks the dialogue to confirm whether the agent stayed on message. This dual approach ensures agents are prepared before the pitch and held accountable during it.
This metric is particularly critical in highly regulated environments. In Banking, Insurance, or NBFCs, going off-script is not just a sales problem; it is a severe compliance risk. A Pitch Adherence Score flags immediately if agents are skipping mandatory regulatory disclosures or misrepresenting product terms. In sectors like Pharma, where technical accuracy is paramount, this metric ensures reps communicate clinical benefits exactly as approved by medical and legal teams. It prevents field teams from diluting a carefully crafted value proposition and standardises messaging across all territories.
For Sales Managers, this score shifts coaching from generic advice to surgical intervention. If a regional team shows low pitch adherence during the objection-handling phase, managers know exactly where to step in. They can deploy just-in-time content and targeted battlecards to close that specific capability gap. Rather than spending hours listening to random call recordings, managers can look directly at the adherence data to see which agents need help and exactly what kind of support they require.
Tracking pitch adherence ultimately bridges the gap between strategy and execution. When Chief Revenue Officers launch a new product or update a sales motion, they need a mechanism to ensure the field actually adopts the change. A high adherence score confirms the message has reached the frontline and is being delivered correctly to the buyer. This gives leadership the objective data required to identify what works, correct what fails, and replicate high-impact behaviours across the entire sales floor.
16. First-Year Customer Churn (Track)
First-year customer churn is the ultimate lie-detector test for your sales organisation. While gross bookings tell you how fast your team is running, early churn tells you if they are running in the right direction. It serves as a hard reality check on the quality of your revenue. When this metric spikes, it rarely points to a product failure. Instead, it indicates a severe execution flaw on the frontline: reps are either aggressively overselling capabilities to force a close, or they are targeting the wrong customer profile simply to hit their monthly quotas.
The financial damage of early attrition is unforgiving. If you are operating in insurance, banking, or complex B2B sales, the cost to acquire a new customer heavily outweighs the initial transaction value. Current industry data from 2026 highlights the severity of this issue; in the insurance sector, poor expectation setting and misalignment can drive first-year churn rates as high as 30%. Similarly, retail banking frequently sees up to 15% of new accounts abandon their relationship within the first twelve months due to early friction and unmet promises. When a customer abandons your product before you have recovered the Customer Acquisition Cost (CAC), your sales team is actively destroying enterprise value, not creating it.
High first-year churn is almost always a symptom of a sales enablement gap. When frontline sales agents lack on-the-fly support, dynamic battlecards, or precise product illustrators, they improvise. Under pressure to hit targets, they go off-script, making promises the business cannot keep or forcing a complex financial product onto a poor-fit buyer. They win the deal, but set the organisation up for a guaranteed loss.
To correct this, Chief Revenue Officers and SVPs of Sales must enforce execution consistency across distributed geographies. This requires shifting away from static training and moving toward field-tested sales playbook automation. When managers deploy automated pitch frameworks and just-in-time content, they ensure every rep is selling the actual capabilities of the product to the right ideal customer profile. By integrating AI role-plays and standardised objection-handling paths before the deal is ever signed, leaders can identify capability gaps early and prevent rogue selling behaviours that lead to future cancellations.
Tracking first-year customer churn shifts your focus from merely acquiring revenue to acquiring sustainable, high-margin partnerships. By holding sales managers accountable for the retention of their cohorts, you force the entire frontline to prioritise accurate discovery and honest product representation. The goal is to stop celebrating bad revenue and start replicating the high-impact behaviours of reps who close sticky, long-term business.
Final Strategic Conclusion
Transitioning from a top performer to a sales manager requires a fundamental shift in perspective. You are no longer responsible for hitting a personal quota; you are responsible for the systems that make a quota achievable for dozens of people across distributed geographies. While the 16 metrics discussed provide the visibility needed to diagnose team health, data alone does not drive revenue. The most successful managers in 2026 recognise that tracking lagging indicators like "Total Revenue" is simply a post-mortem. To move the needle, you must obsess over the leading indicators that reflect daily sales execution and behavioural consistency.
Your strategic path forward must prioritise lead activation speed and playbook adoption. In enterprise sectors like Banking, Insurance, and Pharma, the gap between a lead being assigned and a high-quality interaction occurring is where most revenue is lost. If your agents are not equipped with just-in-time content or interactive product illustrations during the first touchpoint, your conversion rates will suffer regardless of how many leads you generate. You must bridge the gap between "knowing what to do" and "doing it at the point of sale."
My final authoritative recommendation is to stop manual tracking and start automating the enablement process. Do not let your CRM become a graveyard of historical data used only for end-of-month post-mortems. Instead, build a culture centred on sales execution consistency. Focus your coaching on the "how"—ensuring every agent masters objection handling and follows a standardised sales playbook.
If you focus your leadership on identifying capability gaps and replicating high-impact behaviours across the entire frontline, the revenue targets will take care of themselves. Execution is the only differentiator in a crowded market that cannot be easily replicated by your competitors. Invest in the tools that allow your team to pitch with precision, and you will turn a distributed group of individuals into a high-performance sales engine.
What’s a Rich Text element?
The rich text element allows you to create and format headings, paragraphs, blockquotes, images, and video all in one place instead of having to add and format them individually. Just double-click and easily create content.
Static and dynamic content editing
A rich text element can be used with static or dynamic content. For static content, just drop it into any page and begin editing. For dynamic content, add a rich text field to any collection and then connect a rich text element to that field in the settings panel. Voila!
How to customize formatting for each rich text
Headings, paragraphs, blockquotes, figures, images, and figure captions can all be styled after a class is added to the rich text element using the "When inside of" nested selector system.
zdxfhgfg
- sdnslk,xdv
- SDlknjsdv
- SDvlknj
- sdgdf v