
From Dashboard to Intervention: Why Sales Managers Need an Activity Center, Not Another Report

Enterprise sales managers in 2026 are drowning in data but starving for direction. Every Monday morning, leadership teams review CRM dashboards showing missed quotas, stalled pipelines

From Dashboard to Intervention: Why Sales Managers Need an Activity Center, Not Another Report

Enterprise sales managers in 2026 are drowning in data but starving for direction. Every Monday morning, leadership teams review CRM dashboards showing missed quotas, stalled pipelines, and underperforming reps. The problem is that these visualizations usually explain what has already gone wrong. By the time a revenue dip appears in a report, the window to coach a rep, rescue an account, or correct a broken sales motion has often closed.

Traditional reporting is built around lagging indicators. Win rate, average deal size, quota attainment, and pipeline coverage are useful for reviews, but weak for daily execution. They tell you the house is on fire, but not which room to enter or which action will stop the damage.

This is where sales momentum dies. Managers are forced to become data investigators, digging through static dashboards to find the reason behind a number before they can intervene. In high-volume teams, no manager can manually inspect every lead, follow-up, and customer conversation. Without a system that converts raw sales signals into specific prompts, managers spend more time finding the problem than fixing it.

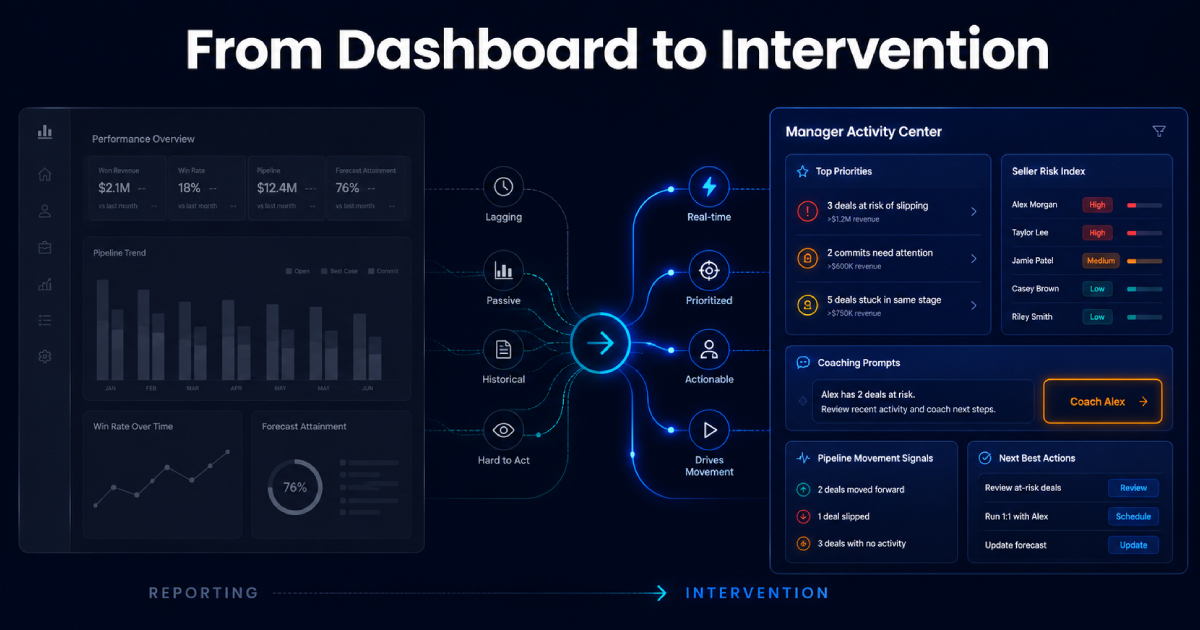
An Activity Center changes this operating model. It moves managers from passive review to real-time intervention. It does not exist to show more charts. It surfaces activity gaps, pipeline movement, seller-level risks, and coaching opportunities that need attention now.
Q1: Why are your current sales dashboards slowing down revenue?

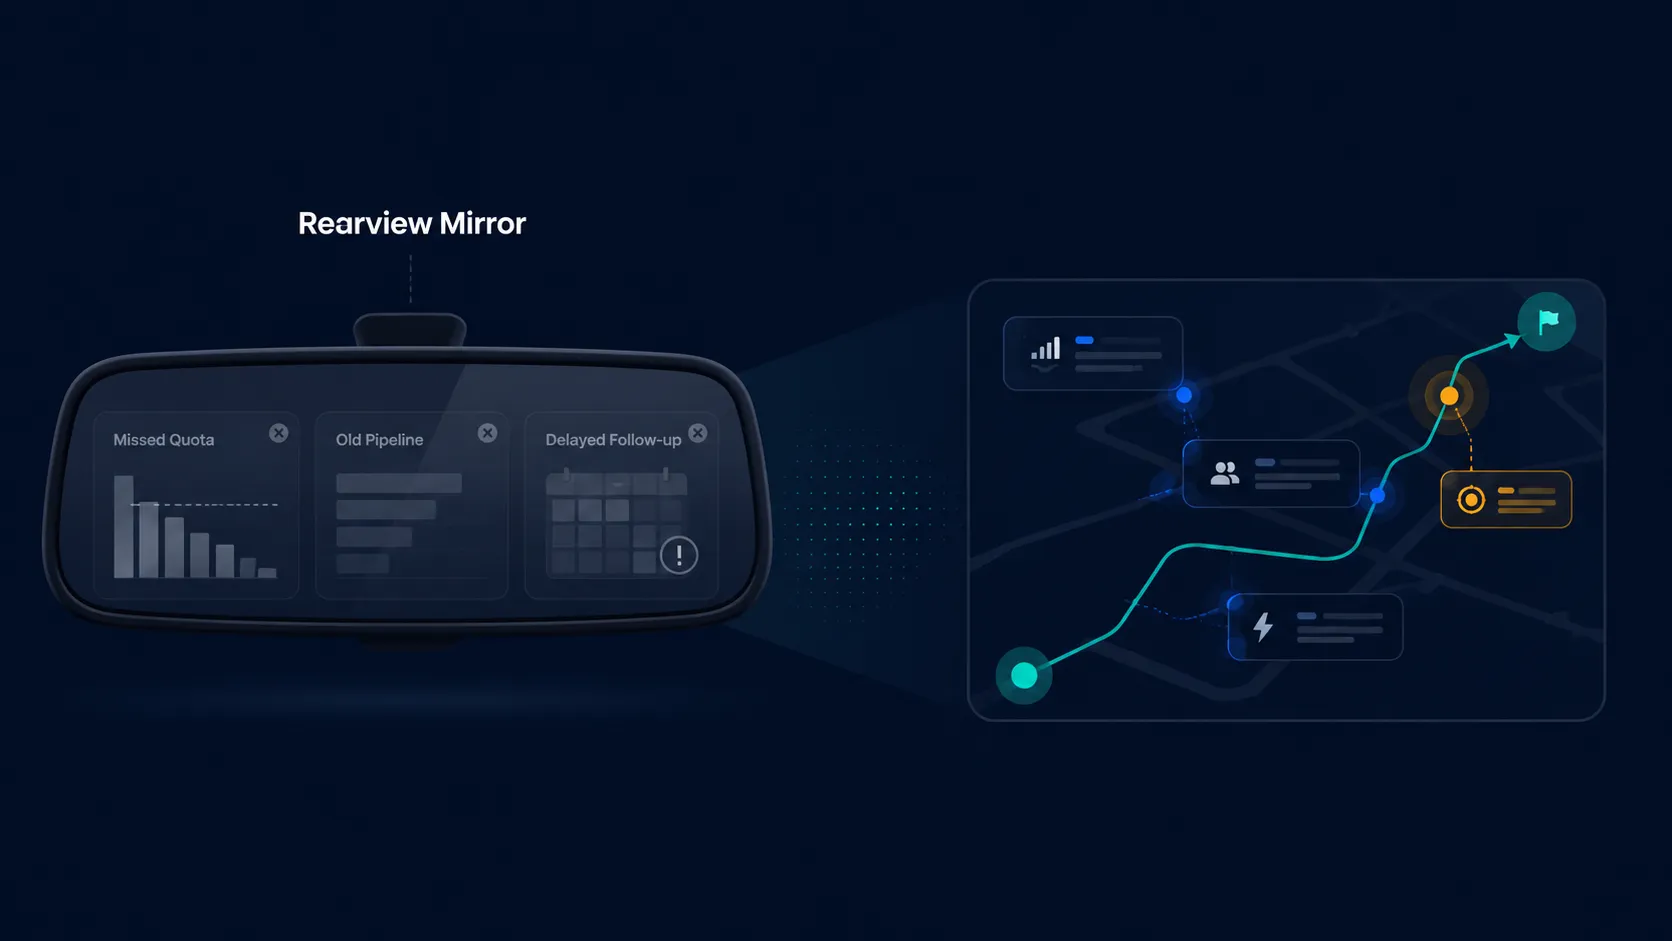
Most dashboards are rearview mirrors, not GPS systems. They show where you have been, but provide limited guidance on what to do next. When a dashboard gives fifty metrics equal visual weight, managers lose the ability to separate signal from noise. A delayed follow-up, a disengaged stakeholder, and a low-risk admin delay can look equally important.

The deeper issue is the dependence on lagging indicators. Metrics like revenue last month, calls made, or average deal size are historical records. By the time they look bad, the underlying behavior has already damaged the pipeline. If your dashboard does not highlight leading indicators like activity gaps, stalled follow-ups, weak buyer engagement, or slow lead response, you are managing by reaction.

Dashboards also lack execution context. They are usually built around internal sales stages, not the customer’s buying journey or the seller’s actual behavior. A prospect does not care whether they are in your “qualified” stage. They care whether their concern has been addressed, whether value is clear, and whether the next step is easy.

This is where many analytics-led tools fall short. They show performance data, but do not help managers decide what to do next. A chart may show a region underperforming. It may even show that a rep has fewer follow-ups than expected. But unless the system converts that gap into a recommended intervention, the manager still carries the burden of diagnosis.

Pro Tip: Stop measuring activity alone. Track Outcome Latency: the time between a customer showing intent and your team delivering the next meaningful action.

Q2: What defines a true Activity Center versus a standard CRM report?

A standard CRM report is passive. It summarizes calls made, meetings completed, pipeline created, deals lost, and revenue generated. It is useful for review, but not for execution. A manager still has to interpret the data, open records, reconstruct context, and decide what action to take.

A true Activity Center is an operational cockpit. It turns live signals into prioritized work. Instead of displaying data as static information, it converts data into tasks, prompts, nudges, coaching moments, and next-best actions.

The distinction lies in active intelligence. A report tells you lead response time is five hours. An Activity Center identifies which high-intent lead has not been acted on, which seller owns it, what activity gap exists, and what should happen next. A report tells you a deal has been in negotiation for too long. An Activity Center shows that procurement has not been engaged, the CFO has not opened the ROI note, and the rep has not followed up in five business days.

This is also where the competitive distinction becomes important. Many systems stop at analytics visibility. They tell leaders what happened across calls, meetings, pipeline, and conversions. That visibility is useful, but incomplete. A Manager Activity Center should go further by showing what is breaking at the seller level and helping the manager act from the same workspace.

A simple test works well: can the manager take action from the insight itself? If a user cannot send a nudge, assign a coaching task, trigger a follow-up, or escalate a deal from the same view, it is not an Activity Center. It is another report.

Pro Tip: Measure active time-to-touch. If managers spend more than 30 seconds deciding where to intervene, the system is still carrying too much click-debt.

Q3: How does action-based reporting shorten the enterprise sales cycle?

Action-based reporting eliminates the lag between data collection and execution. Enterprise buyers leave signals throughout the journey. They revisit pricing pages, open technical documents, ask competitor questions, delay meetings, add stakeholders, or go silent after a proposal. Traditional reporting captures these signals too late. Action-based reporting turns them into immediate triggers.

This shortens the cycle by removing dead air. When a prospect engages with a technical case study or revisits an ROI calculator, the system should not wait for a weekly review. It should prompt the rep or manager with the most relevant next step, such as sharing a security note, scheduling a technical discussion, or looping in a senior stakeholder.

It also helps manage the buying committee. Enterprise deals rarely move through one decision-maker. If legal, finance, IT, or procurement enters the journey, the account strategy must change quickly. A passive report may reveal this after the deal slows down. An Activity Center surfaces it while there is still time to multi-thread.

For large distributed teams, this matters even more. Sales execution breaks not because leaders lack dashboards, but because actions do not happen consistently across thousands of sellers. One seller follows up on time. Another forgets. One seller handles objections well. Another avoids the difficult conversation. Action-based reporting reduces this variance by making the next step visible and specific.

Pro Tip: Map next-best-action playbooks directly into the Activity Center. When a lead is flagged, the content, message, or meeting request should be visible in the same window.
Q4: Why is Time to Intervention the most critical metric for managers?

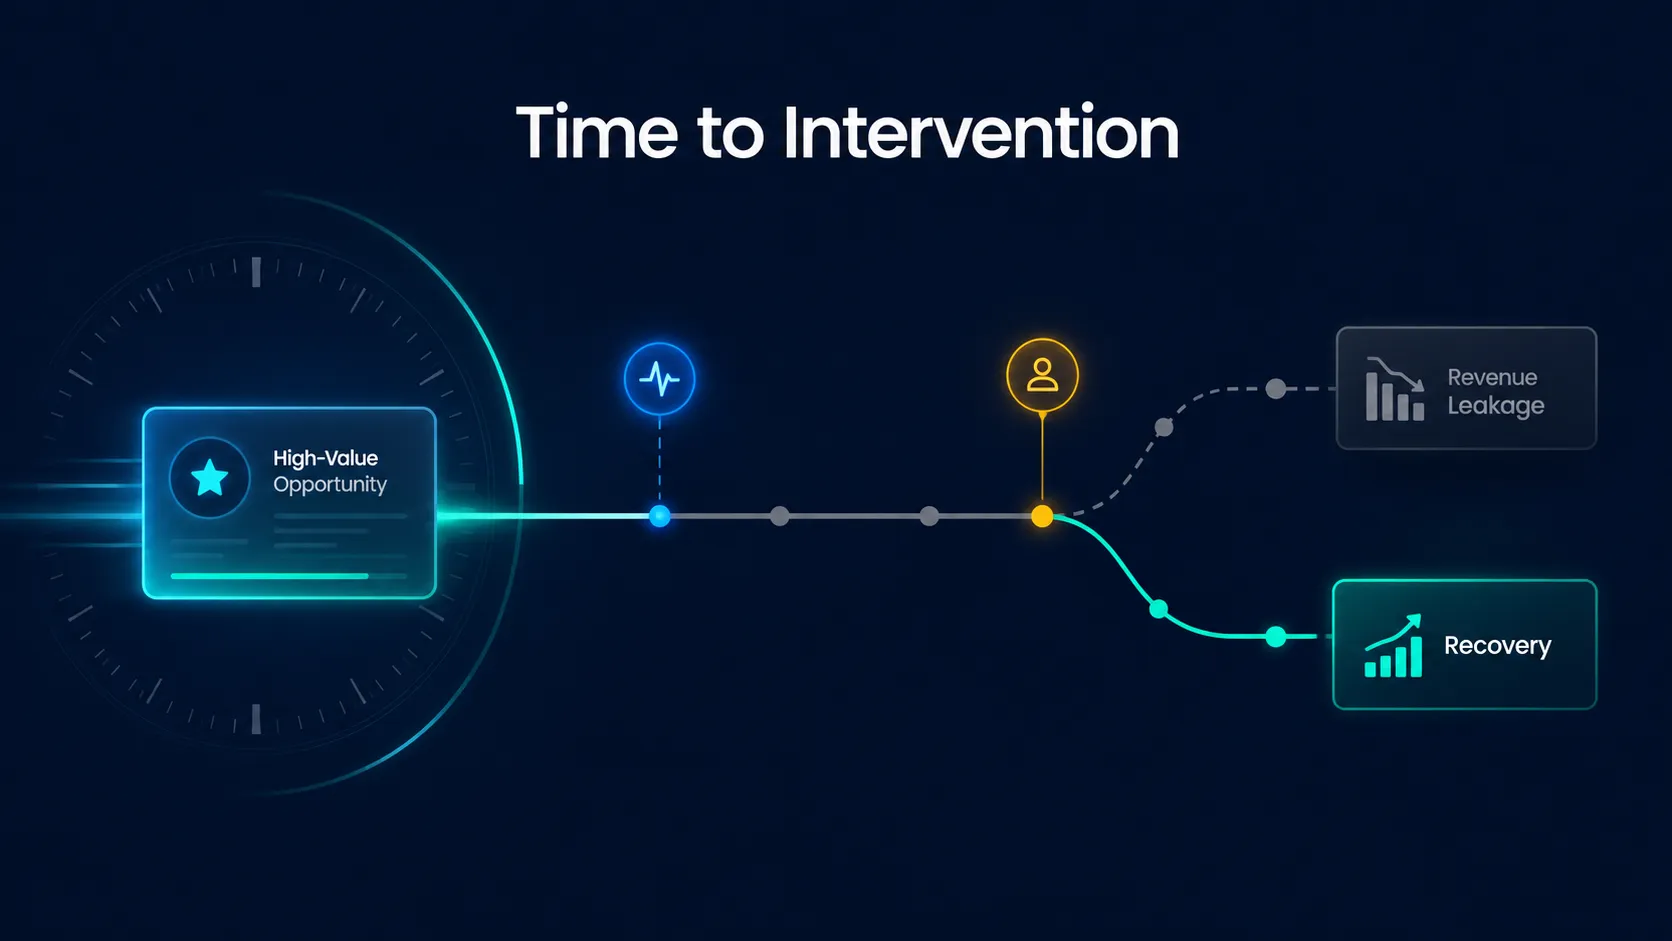
Time to Intervention is the gap between a risk signal appearing and a corrective action being initiated. For sales managers, it is one of the most important execution metrics because revenue leakage rarely happens suddenly. It happens quietly through delayed follow-ups, weak objection handling, poor stakeholder coverage, and inconsistent activity discipline.

Traditional sales management measures outcomes after the fact. Time to Intervention measures the organization’s ability to respond while the outcome is still changeable. If a high-value opportunity has no next step, waiting for the monthly pipeline review is too late. If a rep repeatedly fails to follow up after demos, reviewing performance at quarter-end is too late.

High TTI usually means the organization has too many silos, too much manual reporting, or too little clarity on who owns the next action. Managers may have data, but not the workflow to act on it.

Reducing TTI requires real-time signals, clear ownership, and predefined actions. Managers should not need to ask, “What happened?” after every dashboard review. The system should show what changed, why it matters, who owns it, and what should happen next.

Pro Tip: Track Negative Momentum: the speed at which a deal, account, or seller performance indicator worsens when no one intervenes.

Q5: How can an Activity Center stop high-value deals from stalling mid-funnel?

Mid-funnel is where many high-value enterprise deals lose momentum. The prospect has shown interest. The first conversations may have gone well. But then the buyer needs internal alignment, the seller waits for a response, and the manager discovers the slowdown only when the opportunity is stale.

Activity Centers prevent this by detecting stall patterns early. A deal should not be considered healthy just because it is still in the pipeline. It is healthy only if there is forward motion. Has the next meeting been scheduled? Has the business case been shared? Has the decision-maker been engaged? Has the seller followed up after the demo? Has the customer interacted with the proposal?

A standard report may show that a deal is in the proposal stage. An Activity Center shows whether the deal is actually moving.

The most common mid-funnel risks are easy to miss: the rep is speaking to only one champion, no decision-maker has been added, the follow-up is generic, the value case is unclear, or the buyer has gone silent after asking a tough question. Each of these should trigger manager intervention.

The point is not to replace the manager’s judgment. It is to improve the manager’s timing. Good managers already know how to coach. The challenge is knowing where to coach first when there are hundreds of deals and dozens of sellers.

Pro Tip: Create a Deal Momentum Score using activity recency, stakeholder coverage, buyer engagement, and next-step clarity. Pipeline value without momentum is hope disguised as forecast.

Q6: Why are traditional reports creating pipeline blind spots?

Traditional reports create blind spots because they over-index on what is easy to count. Calls made, meetings completed, leads assigned, and opportunities created may look impressive, but they do not prove that selling quality is improving.

A call made is not the same as a conversation. A meeting completed is not the same as progress. A proposal sent is not the same as buyer alignment. This is where reporting creates false confidence. The pipeline looks active on paper, but the ground reality may be weak.

The biggest blind spot is the gap between activity and outcome. Teams may celebrate higher activity while conversion quality declines. Managers may see tasks logged, but not whether sellers are asking the right questions, addressing objections, or moving customers toward decisions.

Averages create another blind spot. A region may show acceptable activity while a few high-value accounts are deteriorating. A rep may hit call volume targets but fail to progress strategic opportunities. A stage may look healthy while deals inside it have no stakeholder engagement.

This is why manager-facing systems must go beyond analytics. They must expose execution reality: where activity discipline is weak, where pipeline movement has slowed, where conversations are breaking down, and where coaching can change behavior.

Pro Tip: Stop optimizing for averages. Segment your highest-value deals and analyze their journey separately. The behaviors that move your best deals are often different from the behaviors that create the most activity.

Q7: What is the financial cost of passive monitoring?

Passive monitoring is expensive because it creates the illusion of control while revenue leakage continues. The organization has dashboards, reports, and reviews, but no real-time mechanism to intervene.

The first cost is lost revenue. When a hot lead is not contacted quickly, when a proposal is not followed up, or when a rep misses an objection, the opportunity does not always fail immediately. It slowly loses urgency. By the time the manager notices, the deal has cooled.

The second cost is inflated sales effort. Reps spend more time reviving stale opportunities and chasing unresponsive buyers. Managers spend more time asking for updates instead of coaching. Leadership spends more time questioning forecast accuracy because the system does not capture execution reality.

The third cost is discounting. When teams fail to intervene early, they often try to save deals late through price concessions. A timely value conversation is replaced by a last-minute discount. That damages margins and trains customers to wait.

The hidden cost is managerial capacity. A manager’s most valuable time should be spent improving seller behavior, not reconciling dashboards. Every hour spent searching for the problem is an hour not spent fixing it.

Pro Tip: Track Account Health Velocity. A high average pipeline score can hide high-value deals that are rapidly deteriorating. The speed and direction of change matter more than the static score.

Q8: How do Activity Centers help managers coach instead of audit?

Traditional dashboards push managers into an auditing role. They review past activity, question missed targets, and ask reps to explain what happened. This creates a policing dynamic. The manager becomes a reviewer of failure instead of a shaper of performance.

Activity Centers change the conversation. They give managers visibility into leading indicators: follow-up gaps, deal stalls, weak engagement, missed tasks, low activity discipline, poor stakeholder coverage, and repeated friction points. This allows coaching while behavior can still be corrected.

Instead of asking, “Why did you miss your activity quota?” the manager can ask, “I see your follow-ups drop after the second meeting. How can we strengthen that step?” Instead of asking, “Why is this deal stuck?” the manager can say, “You are single-threaded with one champion. Let’s map the buying committee before the next call.”

The strongest coaching systems do not only show that a seller is behind. They show why the seller is behind. Is it poor follow-up discipline? Weak objection handling? Low product confidence? Lack of stakeholder expansion? Slow activity updates? Each reason requires a different coaching response.

Activity Centers also reduce the burden on reps. When activity, context, and outcomes are captured properly, reps spend less time preparing status updates and more time discussing strategy.

Pro Tip: Build a Golden Cadence view. Identify the sequence of activities that led to your strongest wins and compare open opportunities against that pattern.

Q9: Which data triggers turn a report into a high-impact intervention?

A report becomes useful only when it triggers timely action. Otherwise, it is a description of the past.

The most important triggers reveal immediate risk or opportunity: no follow-up after a customer meeting, no activity on a high-value deal for several days, repeated unanswered calls without alternate outreach, lack of stakeholder expansion, buyer engagement dropping after a proposal, or a rep consistently losing deals at the same stage.

Activity gaps are one of the most practical triggers. If a seller is assigned leads but has not taken the right next action, the manager should know immediately. If follow-ups are delayed beyond the expected window, the system should surface it. If pipeline movement slows for a seller or team, the manager should see whether the issue is volume, quality, discipline, or coaching.

Conversation gaps are equally important. If sellers are consistently unable to answer a particular objection, avoid certain products, or fail to explain value clearly, the manager needs visibility into that pattern. This turns coaching from generic motivation into targeted skill improvement.

The strongest Activity Centers connect every trigger to a playbook. A stalled follow-up triggers a reminder. A single-threaded deal triggers a multi-threading action. A pricing objection triggers a value calculator or ROI narrative. A repeated skill gap triggers coaching.

Pro Tip: For every critical metric, define a threshold and response. If a deal remains inactive beyond a defined window, the next action should already be approved.

Q10: How do you transition from dashboard rot to an execution-first culture?

Dashboard rot happens when teams treat data as the destination. They review numbers, discuss trends, and build more reports, but do not change the daily behavior of sellers or managers.

The transition begins with a blunt audit: what specific action did we take the last time this metric moved? If the answer is “we monitored it,” the metric is probably not driving execution.

An execution-first culture prioritizes leading indicators over lagging outcomes. Revenue and win rate still matter, but daily management should focus on the controllable inputs that create them: speed to action, follow-up discipline, stakeholder coverage, pitch quality, objection handling, and deal momentum.

Every dashboard should have a “So What” attached to it. If this number moves, who acts? What do they do? How quickly should they do it? What playbook applies? Without those answers, the dashboard creates visibility but not progress.

Weekly sales reviews should also change. Stop spending the meeting reading data everyone can already see. Spend 10% of the time on what happened and 90% on what the team will do about it. The operating rhythm must reward course correction, not just reporting hygiene.

Data must also live where work happens. If managers have to leave their workflow to find insights, adoption will remain weak. Actionable signals should appear inside the tools where reps and managers already execute.

Pro Tip: Give dashboards expiration dates. Every report should justify its existence by showing which decisions, interventions, or performance improvements it enabled.

Conclusion

Data visibility is no longer the bottleneck for enterprise sales teams. The real problem is the analysis gap: the time wasted between seeing a trend and knowing which rep, deal, or customer conversation requires action.

Static reports provide a historical record. Activity Centers create a path forward. They convert raw sales signals into prioritized interventions, helping managers move from passive review to active revenue management.

In 2026, the best sales leaders will not treat the CRM as a storage locker. They will treat it as an execution engine. The manager’s role will not be to inspect every number manually. It will be to coach, intervene, and improve selling quality at the moment it matters.

This is where Sharpsell’s Manager Activity Center fits into the larger shift. It gives managers actionable visibility into activity gaps, pipeline movement, and coaching opportunities instead of only showcasing analytics. More importantly, it can provide AI-based recommendations on what leaders and managers should do next, so intervention becomes faster, more consistent, and easier to scale across distributed sales teams.

Efficiency in enterprise sales is built on removing the cognitive load of searching for the problem. When technology surfaces the right problem at the right time, managers can spend their energy where it matters most: helping sellers move deals forward.

Transition your leadership team from observation to intervention. Audit your current reporting stack, identify where insights die, and build an Activity Center that turns data into action.

  • The “New Normal” for Pharma Sales post the lockdown
  • Why organizations look for Sales Enablement
  • How Sales Enablement is different from traditional LMS or CRM
  • The industry best practices for Sales Enablement
  • Implementation challenges and how to overcome them
  • Ensuring higher adoption

Aman Vasishth

Aman Vasishth is a B2B marketing leader who simplifies complex products through storytelling-driven strategy. He has led brand, growth, and content initiatives across fintech and F&B, building scalable marketing systems that drive measurable business impact.

From Dashboard to Intervention: Why Sales Managers Need an Activity Center, Not Another Report

From Dashboard to Intervention: Why Sales Managers Need an Activity Center, Not Another Report

Enterprise sales managers in 2026 are drowning in data but starving for direction. Every Monday morning, leadership teams review CRM dashboards showing missed quotas, stalled pipelines
Aman Vasishth
January 7, 2026

Enterprise sales managers in 2026 are drowning in data but starving for direction. Every Monday morning, leadership teams review CRM dashboards showing missed quotas, stalled pipelines, and underperforming reps. The problem is that these visualizations usually explain what has already gone wrong. By the time a revenue dip appears in a report, the window to coach a rep, rescue an account, or correct a broken sales motion has often closed.

Traditional reporting is built around lagging indicators. Win rate, average deal size, quota attainment, and pipeline coverage are useful for reviews, but weak for daily execution. They tell you the house is on fire, but not which room to enter or which action will stop the damage.

This is where sales momentum dies. Managers are forced to become data investigators, digging through static dashboards to find the reason behind a number before they can intervene. In high-volume teams, no manager can manually inspect every lead, follow-up, and customer conversation. Without a system that converts raw sales signals into specific prompts, managers spend more time finding the problem than fixing it.

An Activity Center changes this operating model. It moves managers from passive review to real-time intervention. It does not exist to show more charts. It surfaces activity gaps, pipeline movement, seller-level risks, and coaching opportunities that need attention now.

Q1: Why are your current sales dashboards slowing down revenue?

Most dashboards are rearview mirrors, not GPS systems. They show where you have been, but provide limited guidance on what to do next. When a dashboard gives fifty metrics equal visual weight, managers lose the ability to separate signal from noise. A delayed follow-up, a disengaged stakeholder, and a low-risk admin delay can look equally important.

The deeper issue is the dependence on lagging indicators. Metrics like revenue last month, calls made, or average deal size are historical records. By the time they look bad, the underlying behavior has already damaged the pipeline. If your dashboard does not highlight leading indicators like activity gaps, stalled follow-ups, weak buyer engagement, or slow lead response, you are managing by reaction.

Dashboards also lack execution context. They are usually built around internal sales stages, not the customer’s buying journey or the seller’s actual behavior. A prospect does not care whether they are in your “qualified” stage. They care whether their concern has been addressed, whether value is clear, and whether the next step is easy.

This is where many analytics-led tools fall short. They show performance data, but do not help managers decide what to do next. A chart may show a region underperforming. It may even show that a rep has fewer follow-ups than expected. But unless the system converts that gap into a recommended intervention, the manager still carries the burden of diagnosis.

Pro Tip: Stop measuring activity alone. Track Outcome Latency: the time between a customer showing intent and your team delivering the next meaningful action.

Q2: What defines a true Activity Center versus a standard CRM report?

A standard CRM report is passive. It summarizes calls made, meetings completed, pipeline created, deals lost, and revenue generated. It is useful for review, but not for execution. A manager still has to interpret the data, open records, reconstruct context, and decide what action to take.

A true Activity Center is an operational cockpit. It turns live signals into prioritized work. Instead of displaying data as static information, it converts data into tasks, prompts, nudges, coaching moments, and next-best actions.

The distinction lies in active intelligence. A report tells you lead response time is five hours. An Activity Center identifies which high-intent lead has not been acted on, which seller owns it, what activity gap exists, and what should happen next. A report tells you a deal has been in negotiation for too long. An Activity Center shows that procurement has not been engaged, the CFO has not opened the ROI note, and the rep has not followed up in five business days.

This is also where the competitive distinction becomes important. Many systems stop at analytics visibility. They tell leaders what happened across calls, meetings, pipeline, and conversions. That visibility is useful, but incomplete. A Manager Activity Center should go further by showing what is breaking at the seller level and helping the manager act from the same workspace.

A simple test works well: can the manager take action from the insight itself? If a user cannot send a nudge, assign a coaching task, trigger a follow-up, or escalate a deal from the same view, it is not an Activity Center. It is another report.

Pro Tip: Measure active time-to-touch. If managers spend more than 30 seconds deciding where to intervene, the system is still carrying too much click-debt.

Q3: How does action-based reporting shorten the enterprise sales cycle?

Action-based reporting eliminates the lag between data collection and execution. Enterprise buyers leave signals throughout the journey. They revisit pricing pages, open technical documents, ask competitor questions, delay meetings, add stakeholders, or go silent after a proposal. Traditional reporting captures these signals too late. Action-based reporting turns them into immediate triggers.

This shortens the cycle by removing dead air. When a prospect engages with a technical case study or revisits an ROI calculator, the system should not wait for a weekly review. It should prompt the rep or manager with the most relevant next step, such as sharing a security note, scheduling a technical discussion, or looping in a senior stakeholder.

It also helps manage the buying committee. Enterprise deals rarely move through one decision-maker. If legal, finance, IT, or procurement enters the journey, the account strategy must change quickly. A passive report may reveal this after the deal slows down. An Activity Center surfaces it while there is still time to multi-thread.

For large distributed teams, this matters even more. Sales execution breaks not because leaders lack dashboards, but because actions do not happen consistently across thousands of sellers. One seller follows up on time. Another forgets. One seller handles objections well. Another avoids the difficult conversation. Action-based reporting reduces this variance by making the next step visible and specific.

Pro Tip: Map next-best-action playbooks directly into the Activity Center. When a lead is flagged, the content, message, or meeting request should be visible in the same window.

Q4: Why is Time to Intervention the most critical metric for managers?

Time to Intervention is the gap between a risk signal appearing and a corrective action being initiated. For sales managers, it is one of the most important execution metrics because revenue leakage rarely happens suddenly. It happens quietly through delayed follow-ups, weak objection handling, poor stakeholder coverage, and inconsistent activity discipline.

Traditional sales management measures outcomes after the fact. Time to Intervention measures the organization’s ability to respond while the outcome is still changeable. If a high-value opportunity has no next step, waiting for the monthly pipeline review is too late. If a rep repeatedly fails to follow up after demos, reviewing performance at quarter-end is too late.

High TTI usually means the organization has too many silos, too much manual reporting, or too little clarity on who owns the next action. Managers may have data, but not the workflow to act on it.

Reducing TTI requires real-time signals, clear ownership, and predefined actions. Managers should not need to ask, “What happened?” after every dashboard review. The system should show what changed, why it matters, who owns it, and what should happen next.

Pro Tip: Track Negative Momentum: the speed at which a deal, account, or seller performance indicator worsens when no one intervenes.

Q5: How can an Activity Center stop high-value deals from stalling mid-funnel?

Mid-funnel is where many high-value enterprise deals lose momentum. The prospect has shown interest. The first conversations may have gone well. But then the buyer needs internal alignment, the seller waits for a response, and the manager discovers the slowdown only when the opportunity is stale.

Activity Centers prevent this by detecting stall patterns early. A deal should not be considered healthy just because it is still in the pipeline. It is healthy only if there is forward motion. Has the next meeting been scheduled? Has the business case been shared? Has the decision-maker been engaged? Has the seller followed up after the demo? Has the customer interacted with the proposal?

A standard report may show that a deal is in the proposal stage. An Activity Center shows whether the deal is actually moving.

The most common mid-funnel risks are easy to miss: the rep is speaking to only one champion, no decision-maker has been added, the follow-up is generic, the value case is unclear, or the buyer has gone silent after asking a tough question. Each of these should trigger manager intervention.

The point is not to replace the manager’s judgment. It is to improve the manager’s timing. Good managers already know how to coach. The challenge is knowing where to coach first when there are hundreds of deals and dozens of sellers.

Pro Tip: Create a Deal Momentum Score using activity recency, stakeholder coverage, buyer engagement, and next-step clarity. Pipeline value without momentum is hope disguised as forecast.

Q6: Why are traditional reports creating pipeline blind spots?

Traditional reports create blind spots because they over-index on what is easy to count. Calls made, meetings completed, leads assigned, and opportunities created may look impressive, but they do not prove that selling quality is improving.

A call made is not the same as a conversation. A meeting completed is not the same as progress. A proposal sent is not the same as buyer alignment. This is where reporting creates false confidence. The pipeline looks active on paper, but the ground reality may be weak.

The biggest blind spot is the gap between activity and outcome. Teams may celebrate higher activity while conversion quality declines. Managers may see tasks logged, but not whether sellers are asking the right questions, addressing objections, or moving customers toward decisions.

Averages create another blind spot. A region may show acceptable activity while a few high-value accounts are deteriorating. A rep may hit call volume targets but fail to progress strategic opportunities. A stage may look healthy while deals inside it have no stakeholder engagement.

This is why manager-facing systems must go beyond analytics. They must expose execution reality: where activity discipline is weak, where pipeline movement has slowed, where conversations are breaking down, and where coaching can change behavior.

Pro Tip: Stop optimizing for averages. Segment your highest-value deals and analyze their journey separately. The behaviors that move your best deals are often different from the behaviors that create the most activity.

Q7: What is the financial cost of passive monitoring?

Passive monitoring is expensive because it creates the illusion of control while revenue leakage continues. The organization has dashboards, reports, and reviews, but no real-time mechanism to intervene.

The first cost is lost revenue. When a hot lead is not contacted quickly, when a proposal is not followed up, or when a rep misses an objection, the opportunity does not always fail immediately. It slowly loses urgency. By the time the manager notices, the deal has cooled.

The second cost is inflated sales effort. Reps spend more time reviving stale opportunities and chasing unresponsive buyers. Managers spend more time asking for updates instead of coaching. Leadership spends more time questioning forecast accuracy because the system does not capture execution reality.

The third cost is discounting. When teams fail to intervene early, they often try to save deals late through price concessions. A timely value conversation is replaced by a last-minute discount. That damages margins and trains customers to wait.

The hidden cost is managerial capacity. A manager’s most valuable time should be spent improving seller behavior, not reconciling dashboards. Every hour spent searching for the problem is an hour not spent fixing it.

Pro Tip: Track Account Health Velocity. A high average pipeline score can hide high-value deals that are rapidly deteriorating. The speed and direction of change matter more than the static score.

Q8: How do Activity Centers help managers coach instead of audit?

Traditional dashboards push managers into an auditing role. They review past activity, question missed targets, and ask reps to explain what happened. This creates a policing dynamic. The manager becomes a reviewer of failure instead of a shaper of performance.

Activity Centers change the conversation. They give managers visibility into leading indicators: follow-up gaps, deal stalls, weak engagement, missed tasks, low activity discipline, poor stakeholder coverage, and repeated friction points. This allows coaching while behavior can still be corrected.

Instead of asking, “Why did you miss your activity quota?” the manager can ask, “I see your follow-ups drop after the second meeting. How can we strengthen that step?” Instead of asking, “Why is this deal stuck?” the manager can say, “You are single-threaded with one champion. Let’s map the buying committee before the next call.”

The strongest coaching systems do not only show that a seller is behind. They show why the seller is behind. Is it poor follow-up discipline? Weak objection handling? Low product confidence? Lack of stakeholder expansion? Slow activity updates? Each reason requires a different coaching response.

Activity Centers also reduce the burden on reps. When activity, context, and outcomes are captured properly, reps spend less time preparing status updates and more time discussing strategy.

Pro Tip: Build a Golden Cadence view. Identify the sequence of activities that led to your strongest wins and compare open opportunities against that pattern.

Q9: Which data triggers turn a report into a high-impact intervention?

A report becomes useful only when it triggers timely action. Otherwise, it is a description of the past.

The most important triggers reveal immediate risk or opportunity: no follow-up after a customer meeting, no activity on a high-value deal for several days, repeated unanswered calls without alternate outreach, lack of stakeholder expansion, buyer engagement dropping after a proposal, or a rep consistently losing deals at the same stage.

Activity gaps are one of the most practical triggers. If a seller is assigned leads but has not taken the right next action, the manager should know immediately. If follow-ups are delayed beyond the expected window, the system should surface it. If pipeline movement slows for a seller or team, the manager should see whether the issue is volume, quality, discipline, or coaching.

Conversation gaps are equally important. If sellers are consistently unable to answer a particular objection, avoid certain products, or fail to explain value clearly, the manager needs visibility into that pattern. This turns coaching from generic motivation into targeted skill improvement.

The strongest Activity Centers connect every trigger to a playbook. A stalled follow-up triggers a reminder. A single-threaded deal triggers a multi-threading action. A pricing objection triggers a value calculator or ROI narrative. A repeated skill gap triggers coaching.

Pro Tip: For every critical metric, define a threshold and response. If a deal remains inactive beyond a defined window, the next action should already be approved.

Q10: How do you transition from dashboard rot to an execution-first culture?

Dashboard rot happens when teams treat data as the destination. They review numbers, discuss trends, and build more reports, but do not change the daily behavior of sellers or managers.

The transition begins with a blunt audit: what specific action did we take the last time this metric moved? If the answer is “we monitored it,” the metric is probably not driving execution.

An execution-first culture prioritizes leading indicators over lagging outcomes. Revenue and win rate still matter, but daily management should focus on the controllable inputs that create them: speed to action, follow-up discipline, stakeholder coverage, pitch quality, objection handling, and deal momentum.

Every dashboard should have a “So What” attached to it. If this number moves, who acts? What do they do? How quickly should they do it? What playbook applies? Without those answers, the dashboard creates visibility but not progress.

Weekly sales reviews should also change. Stop spending the meeting reading data everyone can already see. Spend 10% of the time on what happened and 90% on what the team will do about it. The operating rhythm must reward course correction, not just reporting hygiene.

Data must also live where work happens. If managers have to leave their workflow to find insights, adoption will remain weak. Actionable signals should appear inside the tools where reps and managers already execute.

Pro Tip: Give dashboards expiration dates. Every report should justify its existence by showing which decisions, interventions, or performance improvements it enabled.

Conclusion

Data visibility is no longer the bottleneck for enterprise sales teams. The real problem is the analysis gap: the time wasted between seeing a trend and knowing which rep, deal, or customer conversation requires action.

Static reports provide a historical record. Activity Centers create a path forward. They convert raw sales signals into prioritized interventions, helping managers move from passive review to active revenue management.

In 2026, the best sales leaders will not treat the CRM as a storage locker. They will treat it as an execution engine. The manager’s role will not be to inspect every number manually. It will be to coach, intervene, and improve selling quality at the moment it matters.

This is where Sharpsell’s Manager Activity Center fits into the larger shift. It gives managers actionable visibility into activity gaps, pipeline movement, and coaching opportunities instead of only showcasing analytics. More importantly, it can provide AI-based recommendations on what leaders and managers should do next, so intervention becomes faster, more consistent, and easier to scale across distributed sales teams.

Efficiency in enterprise sales is built on removing the cognitive load of searching for the problem. When technology surfaces the right problem at the right time, managers can spend their energy where it matters most: helping sellers move deals forward.

Transition your leadership team from observation to intervention. Audit your current reporting stack, identify where insights die, and build an Activity Center that turns data into action.

What’s a Rich Text element?

The rich text element allows you to create and format headings, paragraphs, blockquotes, images, and video all in one place instead of having to add and format them individually. Just double-click and easily create content.

Static and dynamic content editing

A rich text element can be used with static or dynamic content. For static content, just drop it into any page and begin editing. For dynamic content, add a rich text field to any collection and then connect a rich text element to that field in the settings panel. Voila!

How to customize formatting for each rich text

Headings, paragraphs, blockquotes, figures, images, and figure captions can all be styled after a class is added to the rich text element using the "When inside of" nested selector system.

zdxfhgfg

  1. sdnslk,xdv
  2. SDlknjsdv
  3. SDvlknj
  • sdgdf v

From Dashboard to Intervention: Why Sales Managers Need an Activity Center, Not Another Report

May 28, 2026
5 min
Aman Vasishth
Aman Vasishth

Enterprise sales managers in 2026 are drowning in data but starving for direction. Every Monday morning, leadership teams review CRM dashboards showing missed quotas, stalled pipelines, and underperforming reps. The problem is that these visualizations usually explain what has already gone wrong. By the time a revenue dip appears in a report, the window to coach a rep, rescue an account, or correct a broken sales motion has often closed.

Traditional reporting is built around lagging indicators. Win rate, average deal size, quota attainment, and pipeline coverage are useful for reviews, but weak for daily execution. They tell you the house is on fire, but not which room to enter or which action will stop the damage.

This is where sales momentum dies. Managers are forced to become data investigators, digging through static dashboards to find the reason behind a number before they can intervene. In high-volume teams, no manager can manually inspect every lead, follow-up, and customer conversation. Without a system that converts raw sales signals into specific prompts, managers spend more time finding the problem than fixing it.

An Activity Center changes this operating model. It moves managers from passive review to real-time intervention. It does not exist to show more charts. It surfaces activity gaps, pipeline movement, seller-level risks, and coaching opportunities that need attention now.

Q1: Why are your current sales dashboards slowing down revenue?

Most dashboards are rearview mirrors, not GPS systems. They show where you have been, but provide limited guidance on what to do next. When a dashboard gives fifty metrics equal visual weight, managers lose the ability to separate signal from noise. A delayed follow-up, a disengaged stakeholder, and a low-risk admin delay can look equally important.

The deeper issue is the dependence on lagging indicators. Metrics like revenue last month, calls made, or average deal size are historical records. By the time they look bad, the underlying behavior has already damaged the pipeline. If your dashboard does not highlight leading indicators like activity gaps, stalled follow-ups, weak buyer engagement, or slow lead response, you are managing by reaction.

Dashboards also lack execution context. They are usually built around internal sales stages, not the customer’s buying journey or the seller’s actual behavior. A prospect does not care whether they are in your “qualified” stage. They care whether their concern has been addressed, whether value is clear, and whether the next step is easy.

This is where many analytics-led tools fall short. They show performance data, but do not help managers decide what to do next. A chart may show a region underperforming. It may even show that a rep has fewer follow-ups than expected. But unless the system converts that gap into a recommended intervention, the manager still carries the burden of diagnosis.

Pro Tip: Stop measuring activity alone. Track Outcome Latency: the time between a customer showing intent and your team delivering the next meaningful action.

Q2: What defines a true Activity Center versus a standard CRM report?

A standard CRM report is passive. It summarizes calls made, meetings completed, pipeline created, deals lost, and revenue generated. It is useful for review, but not for execution. A manager still has to interpret the data, open records, reconstruct context, and decide what action to take.

A true Activity Center is an operational cockpit. It turns live signals into prioritized work. Instead of displaying data as static information, it converts data into tasks, prompts, nudges, coaching moments, and next-best actions.

The distinction lies in active intelligence. A report tells you lead response time is five hours. An Activity Center identifies which high-intent lead has not been acted on, which seller owns it, what activity gap exists, and what should happen next. A report tells you a deal has been in negotiation for too long. An Activity Center shows that procurement has not been engaged, the CFO has not opened the ROI note, and the rep has not followed up in five business days.

This is also where the competitive distinction becomes important. Many systems stop at analytics visibility. They tell leaders what happened across calls, meetings, pipeline, and conversions. That visibility is useful, but incomplete. A Manager Activity Center should go further by showing what is breaking at the seller level and helping the manager act from the same workspace.

A simple test works well: can the manager take action from the insight itself? If a user cannot send a nudge, assign a coaching task, trigger a follow-up, or escalate a deal from the same view, it is not an Activity Center. It is another report.

Pro Tip: Measure active time-to-touch. If managers spend more than 30 seconds deciding where to intervene, the system is still carrying too much click-debt.

Q3: How does action-based reporting shorten the enterprise sales cycle?

Action-based reporting eliminates the lag between data collection and execution. Enterprise buyers leave signals throughout the journey. They revisit pricing pages, open technical documents, ask competitor questions, delay meetings, add stakeholders, or go silent after a proposal. Traditional reporting captures these signals too late. Action-based reporting turns them into immediate triggers.

This shortens the cycle by removing dead air. When a prospect engages with a technical case study or revisits an ROI calculator, the system should not wait for a weekly review. It should prompt the rep or manager with the most relevant next step, such as sharing a security note, scheduling a technical discussion, or looping in a senior stakeholder.

It also helps manage the buying committee. Enterprise deals rarely move through one decision-maker. If legal, finance, IT, or procurement enters the journey, the account strategy must change quickly. A passive report may reveal this after the deal slows down. An Activity Center surfaces it while there is still time to multi-thread.

For large distributed teams, this matters even more. Sales execution breaks not because leaders lack dashboards, but because actions do not happen consistently across thousands of sellers. One seller follows up on time. Another forgets. One seller handles objections well. Another avoids the difficult conversation. Action-based reporting reduces this variance by making the next step visible and specific.

Pro Tip: Map next-best-action playbooks directly into the Activity Center. When a lead is flagged, the content, message, or meeting request should be visible in the same window.

Q4: Why is Time to Intervention the most critical metric for managers?

Time to Intervention is the gap between a risk signal appearing and a corrective action being initiated. For sales managers, it is one of the most important execution metrics because revenue leakage rarely happens suddenly. It happens quietly through delayed follow-ups, weak objection handling, poor stakeholder coverage, and inconsistent activity discipline.

Traditional sales management measures outcomes after the fact. Time to Intervention measures the organization’s ability to respond while the outcome is still changeable. If a high-value opportunity has no next step, waiting for the monthly pipeline review is too late. If a rep repeatedly fails to follow up after demos, reviewing performance at quarter-end is too late.

High TTI usually means the organization has too many silos, too much manual reporting, or too little clarity on who owns the next action. Managers may have data, but not the workflow to act on it.

Reducing TTI requires real-time signals, clear ownership, and predefined actions. Managers should not need to ask, “What happened?” after every dashboard review. The system should show what changed, why it matters, who owns it, and what should happen next.

Pro Tip: Track Negative Momentum: the speed at which a deal, account, or seller performance indicator worsens when no one intervenes.

Q5: How can an Activity Center stop high-value deals from stalling mid-funnel?

Mid-funnel is where many high-value enterprise deals lose momentum. The prospect has shown interest. The first conversations may have gone well. But then the buyer needs internal alignment, the seller waits for a response, and the manager discovers the slowdown only when the opportunity is stale.

Activity Centers prevent this by detecting stall patterns early. A deal should not be considered healthy just because it is still in the pipeline. It is healthy only if there is forward motion. Has the next meeting been scheduled? Has the business case been shared? Has the decision-maker been engaged? Has the seller followed up after the demo? Has the customer interacted with the proposal?

A standard report may show that a deal is in the proposal stage. An Activity Center shows whether the deal is actually moving.

The most common mid-funnel risks are easy to miss: the rep is speaking to only one champion, no decision-maker has been added, the follow-up is generic, the value case is unclear, or the buyer has gone silent after asking a tough question. Each of these should trigger manager intervention.

The point is not to replace the manager’s judgment. It is to improve the manager’s timing. Good managers already know how to coach. The challenge is knowing where to coach first when there are hundreds of deals and dozens of sellers.

Pro Tip: Create a Deal Momentum Score using activity recency, stakeholder coverage, buyer engagement, and next-step clarity. Pipeline value without momentum is hope disguised as forecast.

Q6: Why are traditional reports creating pipeline blind spots?

Traditional reports create blind spots because they over-index on what is easy to count. Calls made, meetings completed, leads assigned, and opportunities created may look impressive, but they do not prove that selling quality is improving.

A call made is not the same as a conversation. A meeting completed is not the same as progress. A proposal sent is not the same as buyer alignment. This is where reporting creates false confidence. The pipeline looks active on paper, but the ground reality may be weak.

The biggest blind spot is the gap between activity and outcome. Teams may celebrate higher activity while conversion quality declines. Managers may see tasks logged, but not whether sellers are asking the right questions, addressing objections, or moving customers toward decisions.

Averages create another blind spot. A region may show acceptable activity while a few high-value accounts are deteriorating. A rep may hit call volume targets but fail to progress strategic opportunities. A stage may look healthy while deals inside it have no stakeholder engagement.

This is why manager-facing systems must go beyond analytics. They must expose execution reality: where activity discipline is weak, where pipeline movement has slowed, where conversations are breaking down, and where coaching can change behavior.

Pro Tip: Stop optimizing for averages. Segment your highest-value deals and analyze their journey separately. The behaviors that move your best deals are often different from the behaviors that create the most activity.

Q7: What is the financial cost of passive monitoring?

Passive monitoring is expensive because it creates the illusion of control while revenue leakage continues. The organization has dashboards, reports, and reviews, but no real-time mechanism to intervene.

The first cost is lost revenue. When a hot lead is not contacted quickly, when a proposal is not followed up, or when a rep misses an objection, the opportunity does not always fail immediately. It slowly loses urgency. By the time the manager notices, the deal has cooled.

The second cost is inflated sales effort. Reps spend more time reviving stale opportunities and chasing unresponsive buyers. Managers spend more time asking for updates instead of coaching. Leadership spends more time questioning forecast accuracy because the system does not capture execution reality.

The third cost is discounting. When teams fail to intervene early, they often try to save deals late through price concessions. A timely value conversation is replaced by a last-minute discount. That damages margins and trains customers to wait.

The hidden cost is managerial capacity. A manager’s most valuable time should be spent improving seller behavior, not reconciling dashboards. Every hour spent searching for the problem is an hour not spent fixing it.

Pro Tip: Track Account Health Velocity. A high average pipeline score can hide high-value deals that are rapidly deteriorating. The speed and direction of change matter more than the static score.

Q8: How do Activity Centers help managers coach instead of audit?

Traditional dashboards push managers into an auditing role. They review past activity, question missed targets, and ask reps to explain what happened. This creates a policing dynamic. The manager becomes a reviewer of failure instead of a shaper of performance.

Activity Centers change the conversation. They give managers visibility into leading indicators: follow-up gaps, deal stalls, weak engagement, missed tasks, low activity discipline, poor stakeholder coverage, and repeated friction points. This allows coaching while behavior can still be corrected.

Instead of asking, “Why did you miss your activity quota?” the manager can ask, “I see your follow-ups drop after the second meeting. How can we strengthen that step?” Instead of asking, “Why is this deal stuck?” the manager can say, “You are single-threaded with one champion. Let’s map the buying committee before the next call.”

The strongest coaching systems do not only show that a seller is behind. They show why the seller is behind. Is it poor follow-up discipline? Weak objection handling? Low product confidence? Lack of stakeholder expansion? Slow activity updates? Each reason requires a different coaching response.

Activity Centers also reduce the burden on reps. When activity, context, and outcomes are captured properly, reps spend less time preparing status updates and more time discussing strategy.

Pro Tip: Build a Golden Cadence view. Identify the sequence of activities that led to your strongest wins and compare open opportunities against that pattern.

Q9: Which data triggers turn a report into a high-impact intervention?

A report becomes useful only when it triggers timely action. Otherwise, it is a description of the past.

The most important triggers reveal immediate risk or opportunity: no follow-up after a customer meeting, no activity on a high-value deal for several days, repeated unanswered calls without alternate outreach, lack of stakeholder expansion, buyer engagement dropping after a proposal, or a rep consistently losing deals at the same stage.

Activity gaps are one of the most practical triggers. If a seller is assigned leads but has not taken the right next action, the manager should know immediately. If follow-ups are delayed beyond the expected window, the system should surface it. If pipeline movement slows for a seller or team, the manager should see whether the issue is volume, quality, discipline, or coaching.

Conversation gaps are equally important. If sellers are consistently unable to answer a particular objection, avoid certain products, or fail to explain value clearly, the manager needs visibility into that pattern. This turns coaching from generic motivation into targeted skill improvement.

The strongest Activity Centers connect every trigger to a playbook. A stalled follow-up triggers a reminder. A single-threaded deal triggers a multi-threading action. A pricing objection triggers a value calculator or ROI narrative. A repeated skill gap triggers coaching.

Pro Tip: For every critical metric, define a threshold and response. If a deal remains inactive beyond a defined window, the next action should already be approved.

Q10: How do you transition from dashboard rot to an execution-first culture?

Dashboard rot happens when teams treat data as the destination. They review numbers, discuss trends, and build more reports, but do not change the daily behavior of sellers or managers.

The transition begins with a blunt audit: what specific action did we take the last time this metric moved? If the answer is “we monitored it,” the metric is probably not driving execution.

An execution-first culture prioritizes leading indicators over lagging outcomes. Revenue and win rate still matter, but daily management should focus on the controllable inputs that create them: speed to action, follow-up discipline, stakeholder coverage, pitch quality, objection handling, and deal momentum.

Every dashboard should have a “So What” attached to it. If this number moves, who acts? What do they do? How quickly should they do it? What playbook applies? Without those answers, the dashboard creates visibility but not progress.

Weekly sales reviews should also change. Stop spending the meeting reading data everyone can already see. Spend 10% of the time on what happened and 90% on what the team will do about it. The operating rhythm must reward course correction, not just reporting hygiene.

Data must also live where work happens. If managers have to leave their workflow to find insights, adoption will remain weak. Actionable signals should appear inside the tools where reps and managers already execute.

Pro Tip: Give dashboards expiration dates. Every report should justify its existence by showing which decisions, interventions, or performance improvements it enabled.

Conclusion

Data visibility is no longer the bottleneck for enterprise sales teams. The real problem is the analysis gap: the time wasted between seeing a trend and knowing which rep, deal, or customer conversation requires action.

Static reports provide a historical record. Activity Centers create a path forward. They convert raw sales signals into prioritized interventions, helping managers move from passive review to active revenue management.

In 2026, the best sales leaders will not treat the CRM as a storage locker. They will treat it as an execution engine. The manager’s role will not be to inspect every number manually. It will be to coach, intervene, and improve selling quality at the moment it matters.

This is where Sharpsell’s Manager Activity Center fits into the larger shift. It gives managers actionable visibility into activity gaps, pipeline movement, and coaching opportunities instead of only showcasing analytics. More importantly, it can provide AI-based recommendations on what leaders and managers should do next, so intervention becomes faster, more consistent, and easier to scale across distributed sales teams.

Efficiency in enterprise sales is built on removing the cognitive load of searching for the problem. When technology surfaces the right problem at the right time, managers can spend their energy where it matters most: helping sellers move deals forward.

Transition your leadership team from observation to intervention. Audit your current reporting stack, identify where insights die, and build an Activity Center that turns data into action.

Readers also liked

11 min
Aman Vasishth
Aman Vasishth
8 min
Aman Vasishth
Aman Vasishth
7 min
Chirag Parmar
Chirag Parmar
11 min
Chirag Parmar
Chirag Parmar

Are you ready to unleash the power of Sales Playbooks for your team?

Thank you! You have been added to our subscriber list!
Oops! Something went wrong while submitting the form.
Thank you! Your submission has been received!
Button Text
Oops! Something went wrong while submitting the form.